


In technical analysis, candlestick patterns play a vital role in helping traders anticipate market movements. One such pattern that often signals a potential reversal at the top of an uptrend is the shooting star. Recognizable by its small body and extended upper shadow, this pattern can offer early warning signs of bearish sentiment building in the market. Here’s a detailed guide to understanding and using the shooting star candlestick in your trading strategy.
What Is a Shooting Star Candlestick?
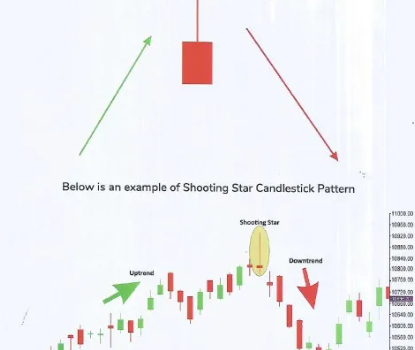
A shooting star is a bearish reversal candlestick that typically appears after an upward price movement. It indicates that buyers pushed prices higher during the trading session, but sellers regained control and drove the price back down by the close. The result is a candle with a small real body near the bottom and a long upper shadow, reflecting the failed attempt by bulls to sustain higher prices.
Structure of the Pattern
This candlestick has a small body positioned at or near the session’s low and a prominent upper wick—usually at least twice the length of the body. The lower shadow is either minimal or completely absent. This structure reflects a shift in market sentiment, where initial bullish momentum is overtaken by a surge in selling pressure.
Understanding Red and Green Shooting Stars
- Red Shooting Star: A red (bearish) shooting star has a close lower than the open, reinforcing the idea that sellers dominated the session. It’s often seen as a stronger signal of potential downside.
- Green Shooting Star: A green shooting star still indicates a reversal, but its close is slightly higher than the open. While still cautionary, traders may look for stronger confirmation when this version appears.
What It Implies for Market Direction
The appearance of a shooting star suggests that an uptrend might be nearing exhaustion. While buyers are still active, the inability to maintain higher prices points to rising seller influence. If the next candle confirms the reversal—typically with a lower close—it can be a signal to consider bearish positions.
Spotting a Shooting Star at Resistance
To validate the shooting star’s significance, traders often look for its formation near a key resistance level. If the upper wick touches or closely approaches a known resistance point and is followed by a drop in price, the likelihood of a trend reversal strengthens. Indicators like volume, RSI, or moving averages can be used alongside the pattern to support trading decisions.
Trading Strategy with the Shooting Star
- Locate the Pattern: Find a small-bodied candle with a long upper shadow during an uptrend.
- Wait for Confirmation: Observe the next candlestick for signs of price weakening, such as a bearish close.
- Set Stop Loss: Place a stop-loss order just above the high of the shooting star to control risk.
- Determine Profit Target: Use support zones or prior consolidation areas as exit points.
- Watch Volume: Increased trading volume during the shooting star formation adds weight to the signal.
- Integrate with Other Tools: Use trend lines, resistance levels, and momentum indicators to validate the signal.
- Stay Disciplined: Always trade within a broader strategy and avoid acting solely on a single pattern.
Pros of Using the Shooting Star Pattern
- Clear Visual Cue: The pattern is easily identifiable on most charts.
- Bearish Signal in Uptrends: Offers an early alert of possible trend changes.
- Risk Control: Stop-loss placement is straightforward based on the candle’s high.
- Works with Other Indicators: Can be reinforced by tools like moving averages and volume analysis.
- Profit Opportunities: Allows timely entry into potential short trades or profit-taking from long positions.
Limitations to Be Aware Of
- Needs Confirmation: The pattern alone isn’t enough—subsequent price action must validate the signal.
- Context-Sensitive: Its reliability depends on where it forms and what other indicators show.
- Not Foolproof: It doesn’t guarantee reversal and should not be used in isolation.
- Market Volatility Impact: In choppy markets, false signals are more likely.
Shooting Star vs. Inverted Hammer
Though similar in appearance, these two candlesticks differ in context. A shooting star forms during an uptrend and suggests a bearish reversal. Conversely, an inverted hammer appears in a downtrend and hints at a bullish reversal. Recognizing the trend preceding the pattern is key to interpreting them correctly.
Final Thoughts
The shooting star candlestick pattern serves as a useful indicator for traders seeking to identify potential trend reversals at market tops. Its structure reflects a weakening in bullish strength and a rise in seller activity. However, like any technical tool, it should not be relied upon in isolation. When combined with confirmation from price action and other analytical tools, it can become a valuable component of a well-rounded trading approach.