


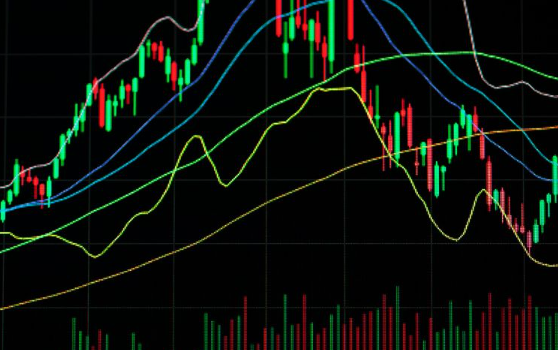
Understanding market movements is critical for successful trading, and one of the most widely used tools for analyzing price action is the candlestick chart. Candlestick patterns reveal vital clues about market sentiment, potential reversals, and continuation trends. For anyone involved in technical analysis, knowing how to recognize and interpret these patterns can provide a decisive edge.
Here’s a comprehensive breakdown of 35 key candlestick patterns, categorized into bullish reversals, bearish reversals, and continuation signals.
Reading Candlesticks: The Basics
Candlesticks reflect price movements over a given period, displaying the opening, closing, high, and low prices. The solid part of the candle—known as the body—indicates the difference between the open and close. Wicks, or shadows, extend from the body to show intraday highs and lows.
- A green (or white) body means the closing price was higher than the opening (bullish).
- A red (or black) body shows the close was lower than the open (bearish).
Bullish Reversal Patterns
These indicate a potential shift from a downtrend to an uptrend.
- Hammer – Appears after a decline, with a small body and a long lower wick.
- Piercing Line – A bullish candle that opens lower but closes above the midpoint of the prior bearish candle.
- Bullish Engulfing – A large bullish candle completely surrounds a smaller prior bearish one.
- Morning Star – A three-candle setup: bearish, indecisive (Doji), and then bullish.
- Three White Soldiers – Three consecutive strong bullish candles with minimal shadows.
- White Marubozu – A long bullish candle with no wicks, signaling strong buyer control.
- Three Inside Up – A bullish Harami followed by a strong bullish confirmation candle.
- Bullish Harami – A small bullish candle within the range of a prior large bearish candle.
- Tweezer Bottom – Two candles at matching lows; one bearish, followed by a bullish candle.
- Inverted Hammer – A candle with a small body and long upper shadow at the bottom of a downtrend.
- Three Outside Up – Begins with a bearish candle followed by a bullish engulfing and another bullish candle.
- On-Neck – A bullish candle closes near the low of a preceding bearish candle.
- Bullish Counterattack – After a downtrend, a bullish candle closes near the previous bearish candle’s close.
Bearish Reversal Patterns
These point to a likely change from an uptrend to a downtrend.
- Hanging Man – Appears after an uptrend; small body on top with a long lower wick.
- Dark Cloud Cover – A bearish candle opens above the prior bullish one but closes below its midpoint.
- Bearish Engulfing – A large bearish candle overtakes a preceding smaller bullish one.
- Evening Star – Bullish candle, followed by a Doji, then a bearish candle indicating reversal.
- Three Black Crows – Three successive bearish candles with minimal shadows.
- Black Marubozu – A strong bearish candle with no upper or lower shadows.
- Three Inside Down – Begins with a bullish Harami, confirmed by a strong bearish third candle.
- Bearish Harami – A small bearish candle inside a larger bullish one.
- Shooting Star – A small body near the low of the candle with a long upper shadow after an uptrend.
- Tweezer Top – Two candles with matching highs, the second being bearish.
- Three Outside Down – Bearish engulfing pattern followed by a confirming bearish candle.
- Bearish Counterattack – Following an uptrend, a bearish candle closes near the previous bullish candle’s close.
Continuation Patterns
These patterns indicate that the current trend is likely to persist.
- Doji – Opening and closing prices are nearly equal; shows indecision.
- Spinning Top – A small body with longer wicks, signaling uncertainty.
- Falling Three Methods – Bearish continuation; long bearish candles at the start and end, with three small bullish candles in between.
- Rising Three Methods – Bullish counterpart to the falling version, indicating trend continuation.
- Upside Tasuki Gap – Two bullish candles with a gap, followed by a bearish one closing the gap.
- Downside Tasuki Gap – Two bearish candles with a gap, followed by a bullish candle that fills the gap.
- Mat-Hold – A bullish pattern starting with a strong bullish candle, followed by a slight pullback, and ending with another upward move.
- Rising Window – A gap between two bullish candles that indicates strong buyer momentum.
- Falling Window – A gap between two bearish candles showing seller dominance.
- High Wave – Candles with small bodies and long wicks on both sides, reflecting extreme indecision.
Final Thoughts
Mastering candlestick patterns requires attention to context and confirmation from broader market trends and indicators. While these patterns are invaluable tools for recognizing potential market shifts or continuation, they should not be used in isolation. Combining candlestick analysis with other forms of technical or fundamental analysis can significantly increase the reliability of your trading decisions. By becoming proficient in these patterns, traders gain a deeper understanding of market psychology and price behavior, ultimately leading to more strategic and confident trades.