


Understanding how to identify potential turning points in the market is essential for every trader. One such clue lies in the form of a single candlestick—known as the Inverted Hammer. This formation often acts as a cue that downward momentum may be weakening, signaling an upcoming shift in direction. Let’s break down what this pattern is, how to spot it, and how to use it effectively in your trading strategy.
What Is the Inverted Hammer Candlestick?
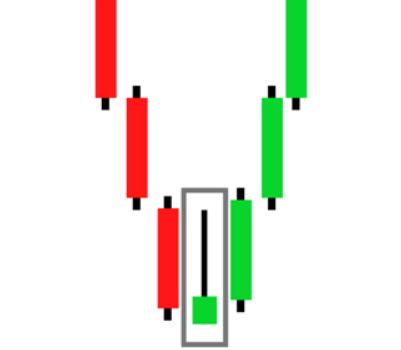
The Inverted Hammer is a single-candle pattern that typically appears after a downward trend. It consists of a small body near the bottom of the trading range and a long upper wick. This formation suggests that although sellers pushed prices lower early in the session, buyers fought back, creating upward pressure before the candle closed. It resembles an upside-down hammer, hinting that the bearish momentum may be losing steam.
Color Interpretation: Red vs. Green Inverted Hammers
While the shape of the candle defines the pattern, its color can provide further insight into market sentiment:
- Red Inverted Hammer: This candle closes lower than it opens, implying that although buyers attempted a rebound, sellers retained control. It’s a weaker bullish signal but still worth watching, especially if followed by a strong upward candle.
- Green Inverted Hammer: This version closes above its opening price, showing stronger buying interest. It’s often viewed as a more convincing indicator of a potential reversal, particularly when followed by additional bullish confirmation.
When Does This Pattern Typically Appear?
The Inverted Hammer pattern tends to form in certain market scenarios, including:
- End of a Downtrend: Its appearance may mark the exhaustion of selling pressure and the beginning of buyer interest.
- Increased Trading Volume: A noticeable uptick in volume can support the idea that buyers are stepping in.
- Weakening Sell-Offs: When sellers struggle to push prices lower, this pattern may surface as a sign of potential reversal.
- Near Support Zones: It gains more significance when it appears near known support levels where buyers are likely to re-enter.
How to Trade the Inverted Hammer Pattern
Trading based on this pattern involves careful planning and risk control. Here’s how to approach it:
1. Identify the Pattern
Look for the characteristic shape—small real body near the low, long upper wick, and little to no lower wick—after a downtrend.
2. Confirm the Signal
Avoid acting on the pattern alone. Wait for follow-up signals such as a bullish candle on the next day, or support from technical indicators like RSI or MACD.
3. Plan Your Entry and Exit
A typical entry point is just above the high of the Inverted Hammer candle. Place a stop-loss just below the candle’s low. Set a profit target based on key resistance levels or use tools like Fibonacci projections for guidance.
4. Track Your Trade
Keep a close eye on market developments, volume changes, and news that may affect the asset. Adjust stop-losses or take-profit levels as needed based on price action.
5. Review Your Performance
After exiting the trade, take time to analyze what worked and what didn’t. Document your observations and refine your strategy accordingly.
Benefits of Using the Inverted Hammer Pattern
This pattern is favored by traders for several reasons:
- Offers early insight into possible market reversals
- Highlights growing buyer interest in bearish environments
- Helps identify entry points near support areas
- Simple to recognize on candlestick charts
Is the Inverted Hammer a Reversal Pattern?
Yes, the Inverted Hammer is most commonly seen as a bullish reversal indicator. However, it should never be used in isolation. For higher probability setups, it must be confirmed with additional bullish candles or volume support. It’s especially effective when combined with other patterns or technical tools that validate the potential reversal.
Final Thoughts
The Inverted Hammer candlestick can serve as an important clue for spotting reversals in a falling market. Its distinct structure provides a visual cue that sellers are losing control and buyers may be stepping in. Still, it’s essential to verify the signal with supporting indicators before making any trading decision. When used wisely as part of a broader technical analysis toolkit, this simple yet powerful pattern can help you capitalize on emerging bullish opportunities.